Gigabyte GA-N680SLI-DQ6: Quad to the Extreme
by Gary Key on February 24, 2007 1:30 AM EST- Posted in
- Motherboards
Disk Controller Performance
The AnandTech iPeak test is designed to measure "pure" hard disk controller performance, and in this case, we keep the hard drive as consistent as possible while varying the hard drive controller. The idea is to measure the performance of each hard drive controller with the same hard drive.
We played back our raw files that are recorded I/O operations when running a real world benchmark - the entire Winstone 2004 suite. Intel's iPeak utility was then used to play back the trace file of all I/O operations that took place during a single run of Business Winstone 2004 and MCC Winstone 2004. To try to isolate performance differences to the controllers that we are testing we are using the Western Digital 74GB Raptor with 16MB cache for both our standard disk controller and RAID performance tests for this article. The drive is formatted before each test run and a composite average of three tests on each controller interface is tabulated in order to ensure consistency in the benchmark.
iPeak gives a mean service time in milliseconds; in other words, the average time that each drive took to fulfill each I/O operation. In order to make the data more understandable, we report the scores as an average number of I/O operations per second so that higher scores translate into better performance. This number is meaningless as far as hard disk performance is concerned, as it is just the number of I/O operations completed in a second. However, the scores are useful for comparing "pure" performance of the storage controllers in this case.


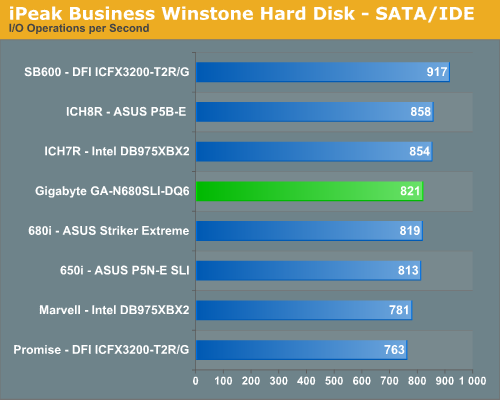
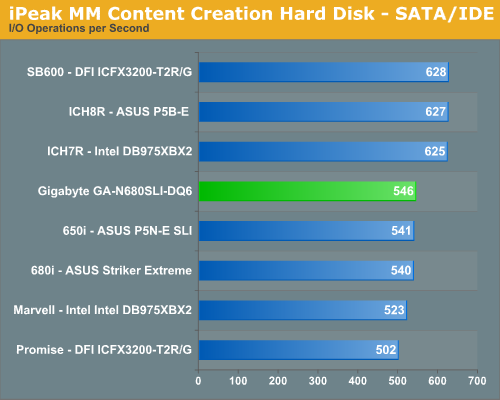
The performance patterns hold steady across both Multimedia Content I/O and Business I/O with the SB600 outperforming the Intel ICH7R, Intel ICH8R, and NVIDIA 680i/650i chipsets in our non-Raid tests. The Promise controller on the DFI board is the slowest of all solutions with the Marvell controller on the Intel 975X performing only slightly better. The 680i and 650i MCP units are different but their disk performance in our tests is basically alike. We also ran RAID 0 and RAID 5 tests on each controller with the results being in favor of the 680i MCP by around 2%. We did not witness any data corruption on either ASUS NVIDIA based board as has been reported on the 680i reference boards, and we consider this problem to be fixed since our P23 BIOS update. We did have data corruption issues with the Gigabyte board when using 1T Command Rate at DDR2-800 with an early F2 beta BIOS. This problem did not occur when using 2T Command Rate and has not been evident in our testing with the F3 BIOS.
Overclocking

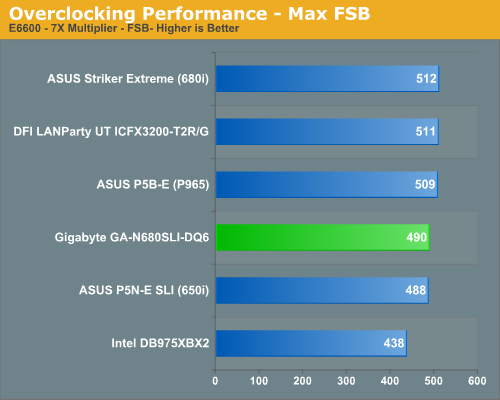
As we mentioned earlier in the article, the overclocking capability of the Gigabyte board has varied widely with each BIOS release we have received. This will be disappointing to some users and we expected a little better overclocking capability based upon the quality of the board and its BIOS options. However, until Gigabyte completes the F3 BIOS tuning we will withhold our final judgment. One area we found interesting is the board did not experience the same number of FSB holes that we have seen on the reference boards. We did not experience the typical FSB hole around 416~423FSB but apparently hit one right around 480 in the latest beta BIOS. We also found that during overclocking we had to set our memory voltages a little higher than on the other boards to attain the same timings. We have experienced this before with the DS3 boards and it was due to tighter sub-timings in order to slightly improve the performance of the board.
The AnandTech iPeak test is designed to measure "pure" hard disk controller performance, and in this case, we keep the hard drive as consistent as possible while varying the hard drive controller. The idea is to measure the performance of each hard drive controller with the same hard drive.
We played back our raw files that are recorded I/O operations when running a real world benchmark - the entire Winstone 2004 suite. Intel's iPeak utility was then used to play back the trace file of all I/O operations that took place during a single run of Business Winstone 2004 and MCC Winstone 2004. To try to isolate performance differences to the controllers that we are testing we are using the Western Digital 74GB Raptor with 16MB cache for both our standard disk controller and RAID performance tests for this article. The drive is formatted before each test run and a composite average of three tests on each controller interface is tabulated in order to ensure consistency in the benchmark.
iPeak gives a mean service time in milliseconds; in other words, the average time that each drive took to fulfill each I/O operation. In order to make the data more understandable, we report the scores as an average number of I/O operations per second so that higher scores translate into better performance. This number is meaningless as far as hard disk performance is concerned, as it is just the number of I/O operations completed in a second. However, the scores are useful for comparing "pure" performance of the storage controllers in this case.


The performance patterns hold steady across both Multimedia Content I/O and Business I/O with the SB600 outperforming the Intel ICH7R, Intel ICH8R, and NVIDIA 680i/650i chipsets in our non-Raid tests. The Promise controller on the DFI board is the slowest of all solutions with the Marvell controller on the Intel 975X performing only slightly better. The 680i and 650i MCP units are different but their disk performance in our tests is basically alike. We also ran RAID 0 and RAID 5 tests on each controller with the results being in favor of the 680i MCP by around 2%. We did not witness any data corruption on either ASUS NVIDIA based board as has been reported on the 680i reference boards, and we consider this problem to be fixed since our P23 BIOS update. We did have data corruption issues with the Gigabyte board when using 1T Command Rate at DDR2-800 with an early F2 beta BIOS. This problem did not occur when using 2T Command Rate and has not been evident in our testing with the F3 BIOS.
Overclocking

As we mentioned earlier in the article, the overclocking capability of the Gigabyte board has varied widely with each BIOS release we have received. This will be disappointing to some users and we expected a little better overclocking capability based upon the quality of the board and its BIOS options. However, until Gigabyte completes the F3 BIOS tuning we will withhold our final judgment. One area we found interesting is the board did not experience the same number of FSB holes that we have seen on the reference boards. We did not experience the typical FSB hole around 416~423FSB but apparently hit one right around 480 in the latest beta BIOS. We also found that during overclocking we had to set our memory voltages a little higher than on the other boards to attain the same timings. We have experienced this before with the DS3 boards and it was due to tighter sub-timings in order to slightly improve the performance of the board.


12 Comments
View All Comments
tuteja1986 - Sunday, February 25, 2007 - link
ahh... english."Well Gigabyte GA-N680SL-DQ6 isn't even selling it. It will sale next month. They still have time to fix the bugs. Anyways i say buying the striker at launch for $400 was a foolish thing to do since it was buggy as hell. It took for them months to fix the problem."
correct :
Gigabyte GA-N680SL-DQ6 isn't even coming out untill next month so i think gigabyte has some time to address the issue and release an bios update for it.
tuteja1986 - Saturday, February 24, 2007 - link
If this board sell for $250 then i would buy it without a second thought. Much cheaper than Striker ; )